Produces a histogram of sequencing depth (coverage) across sites for each
sample in a commaData object. Useful for QC to assess whether
coverage is sufficient and consistent across samples.
Arguments
- object
A
commaDataobject.- mod_type
Character string specifying a single modification type (e.g.,
"6mA","5mC"). IfNULL(default), all sites from all modification types are included.- per_sample
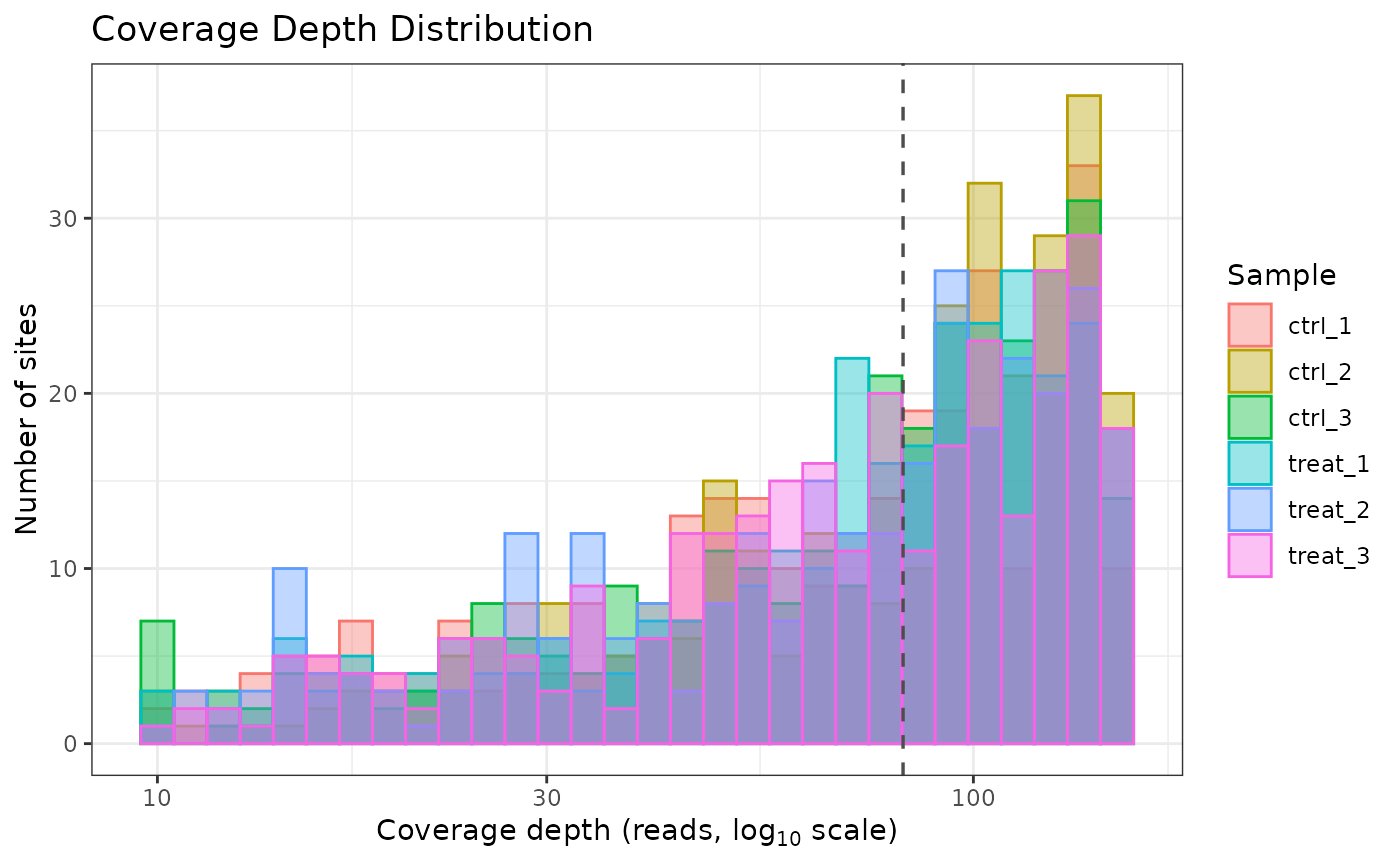
Logical. If
TRUE(default), the plot is faceted by sample, producing one histogram panel per sample. IfFALSE, all samples are overlaid on a single plot with per-sample colors.
Value
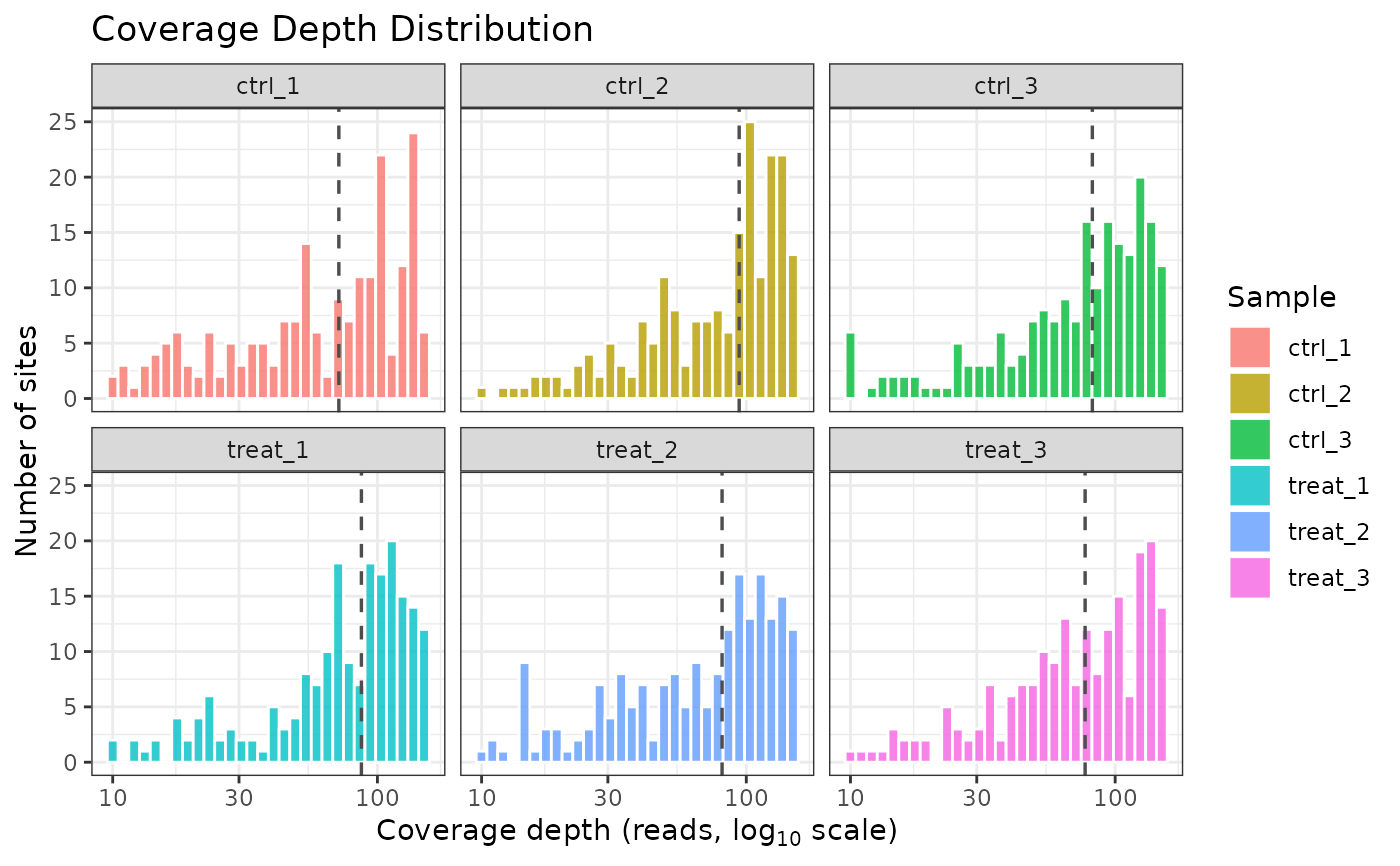
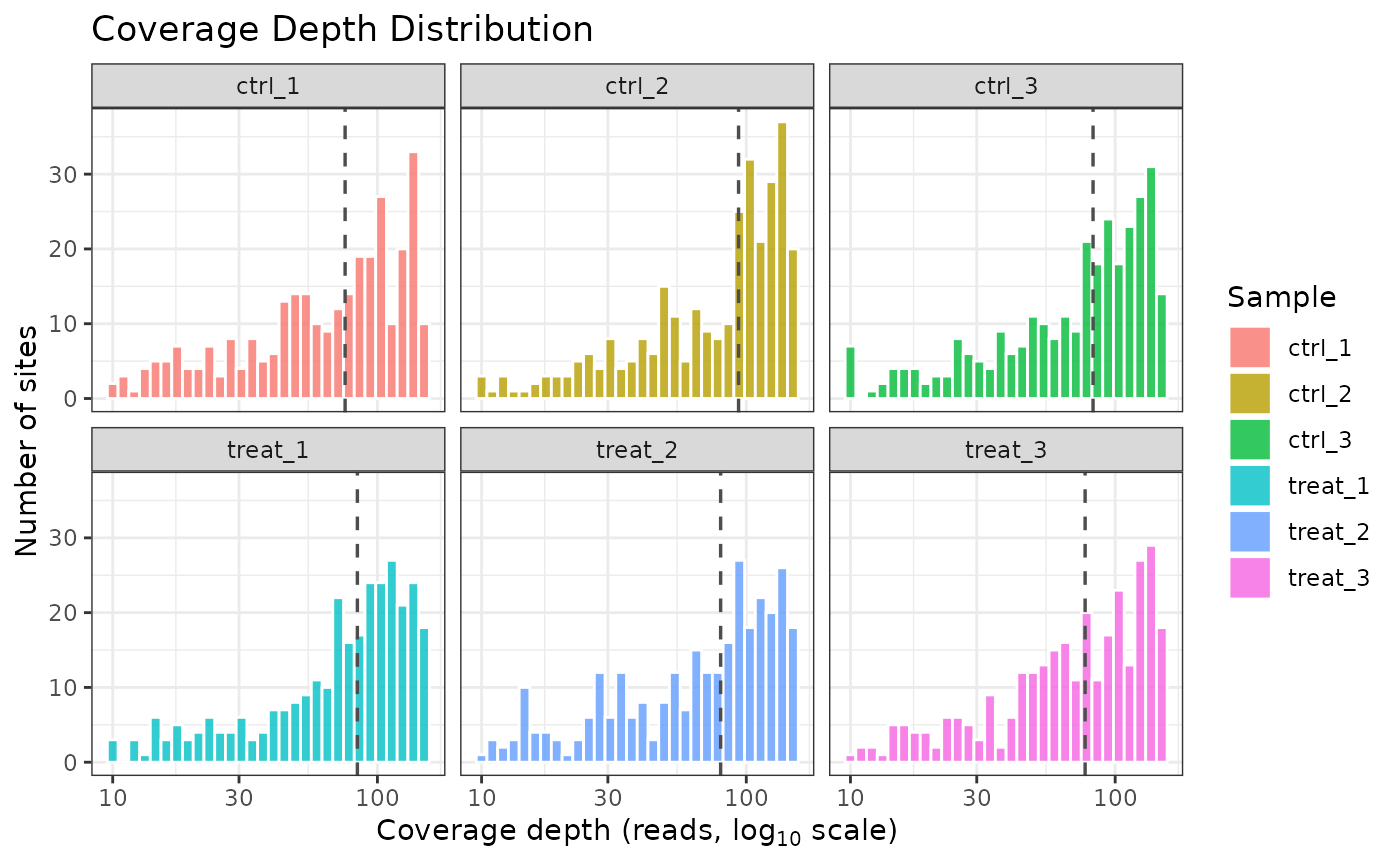
A ggplot object. The x-axis shows coverage
depth on a log10 scale; the y-axis shows the number of sites at each
depth. A vertical dashed line marks the median coverage per sample (when
per_sample = TRUE) or across all samples (when
per_sample = FALSE). Sites with NA coverage are silently
excluded.
Examples
data(comma_example_data)
plot_coverage(comma_example_data)
 # Overlay all samples on one plot
plot_coverage(comma_example_data, per_sample = FALSE)
# Overlay all samples on one plot
plot_coverage(comma_example_data, per_sample = FALSE)
 # One modification type only
plot_coverage(comma_example_data, mod_type = "6mA")
# One modification type only
plot_coverage(comma_example_data, mod_type = "6mA")