Plot methylation beta value distributions
Source:R/plot_distribution.R
plot_methylation_distribution.RdProduces a density plot of methylation beta values (0–1) for each sample
in a commaData object. Useful for QC and for comparing
methylation level distributions across samples and modification types.
Arguments
- object
A
commaDataobject.- mod_type
Character string specifying a single modification type to plot (e.g.,
"6mA","5mC"). IfNULL(default), all modification types are included and the plot is faceted bymod_type.- per_sample
Logical. If
TRUE(default), a separate density curve is drawn for each sample. IfFALSE, a single aggregate density curve is drawn per modification type.
Value
A ggplot object. The x-axis shows beta
values (0 = unmethylated, 1 = fully methylated); the y-axis shows kernel
density. When per_sample = TRUE, curves are colored by
sample_name. When multiple modification types are present (and
mod_type = NULL), the plot is faceted by mod_type. Sites
with NA beta values (below coverage threshold) are silently
excluded.
Examples
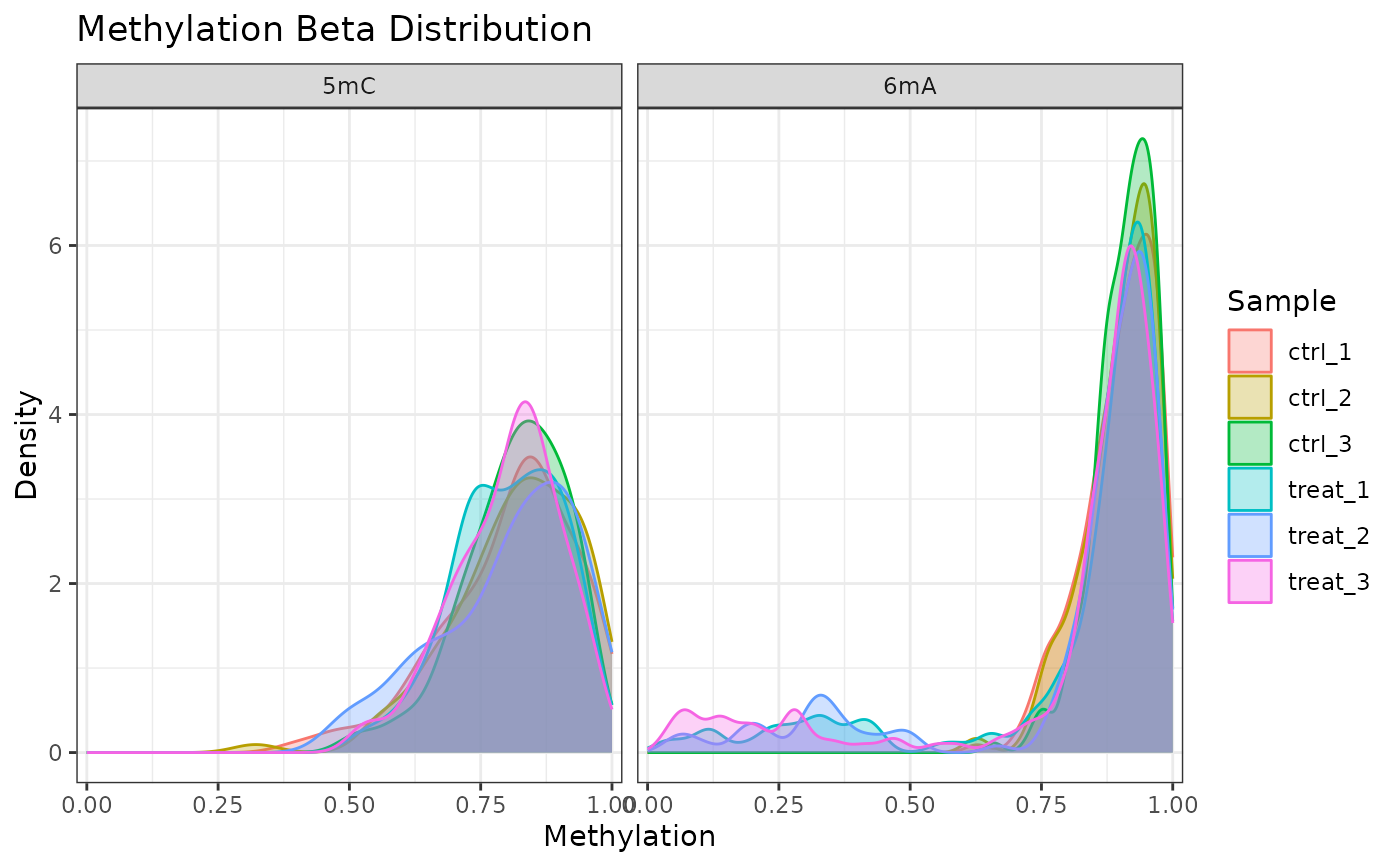
data(comma_example_data)
plot_methylation_distribution(comma_example_data)
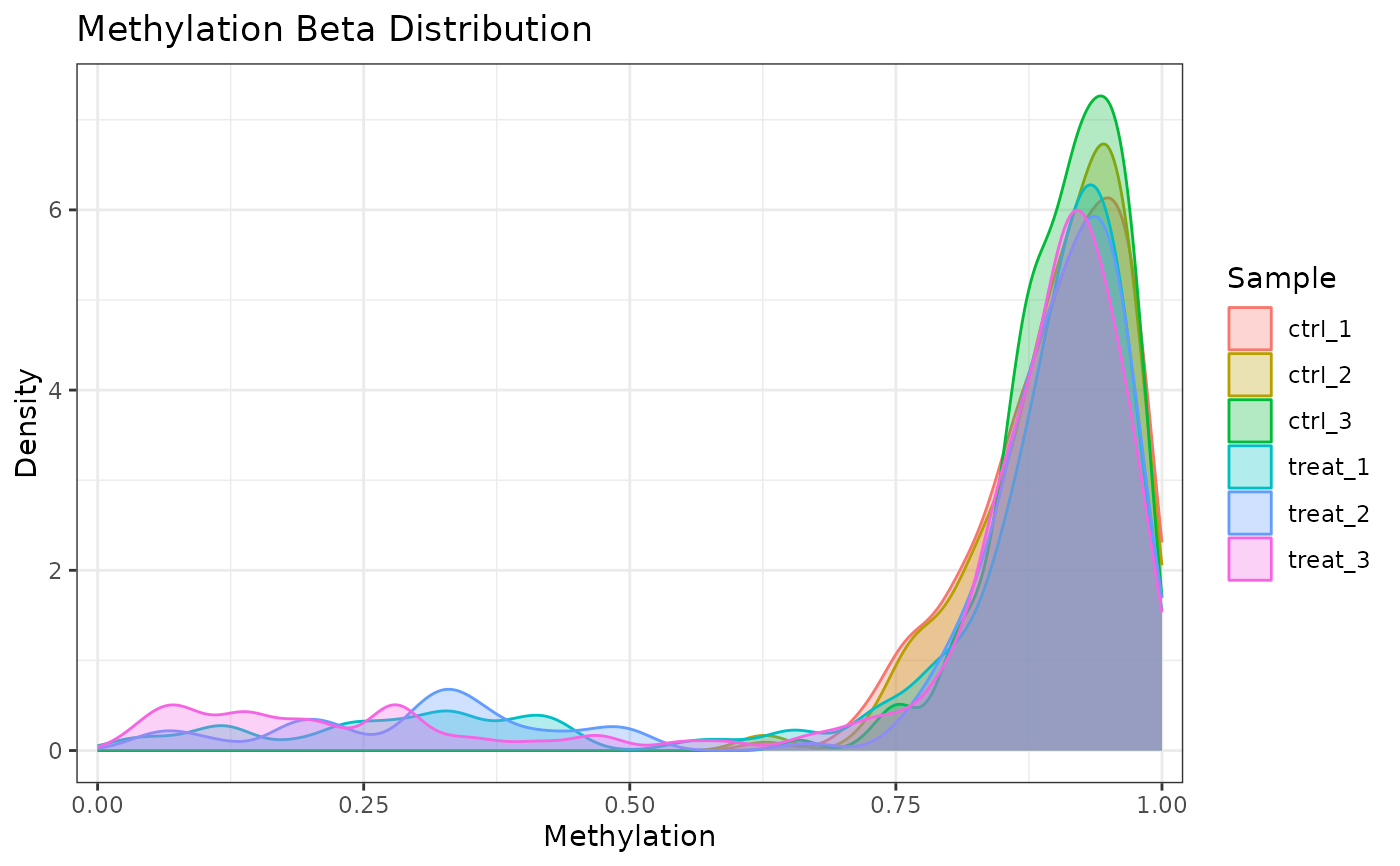
 # One modification type only
plot_methylation_distribution(comma_example_data, mod_type = "6mA")
# One modification type only
plot_methylation_distribution(comma_example_data, mod_type = "6mA")
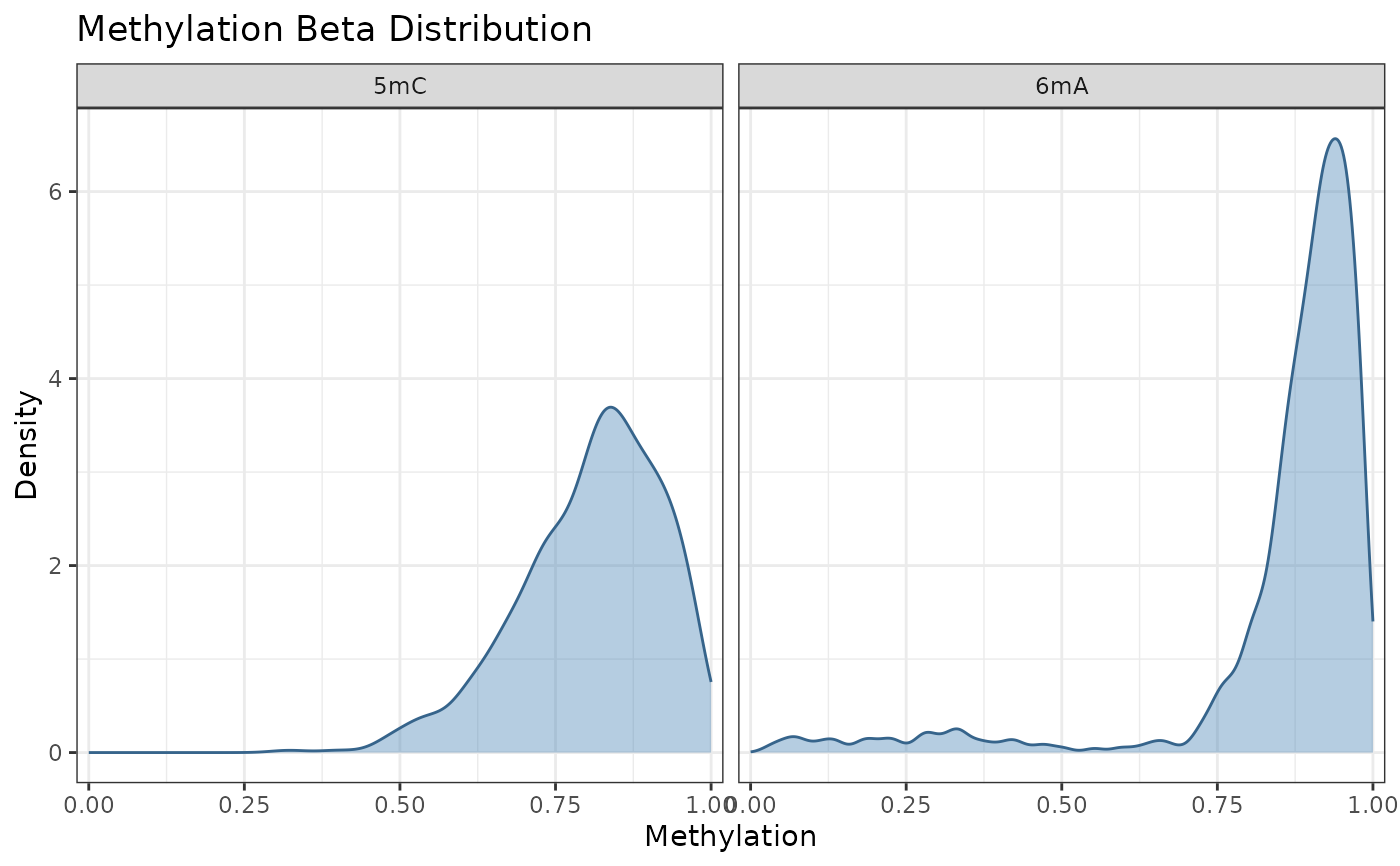
 # Aggregate across samples
plot_methylation_distribution(comma_example_data, per_sample = FALSE)
# Aggregate across samples
plot_methylation_distribution(comma_example_data, per_sample = FALSE)