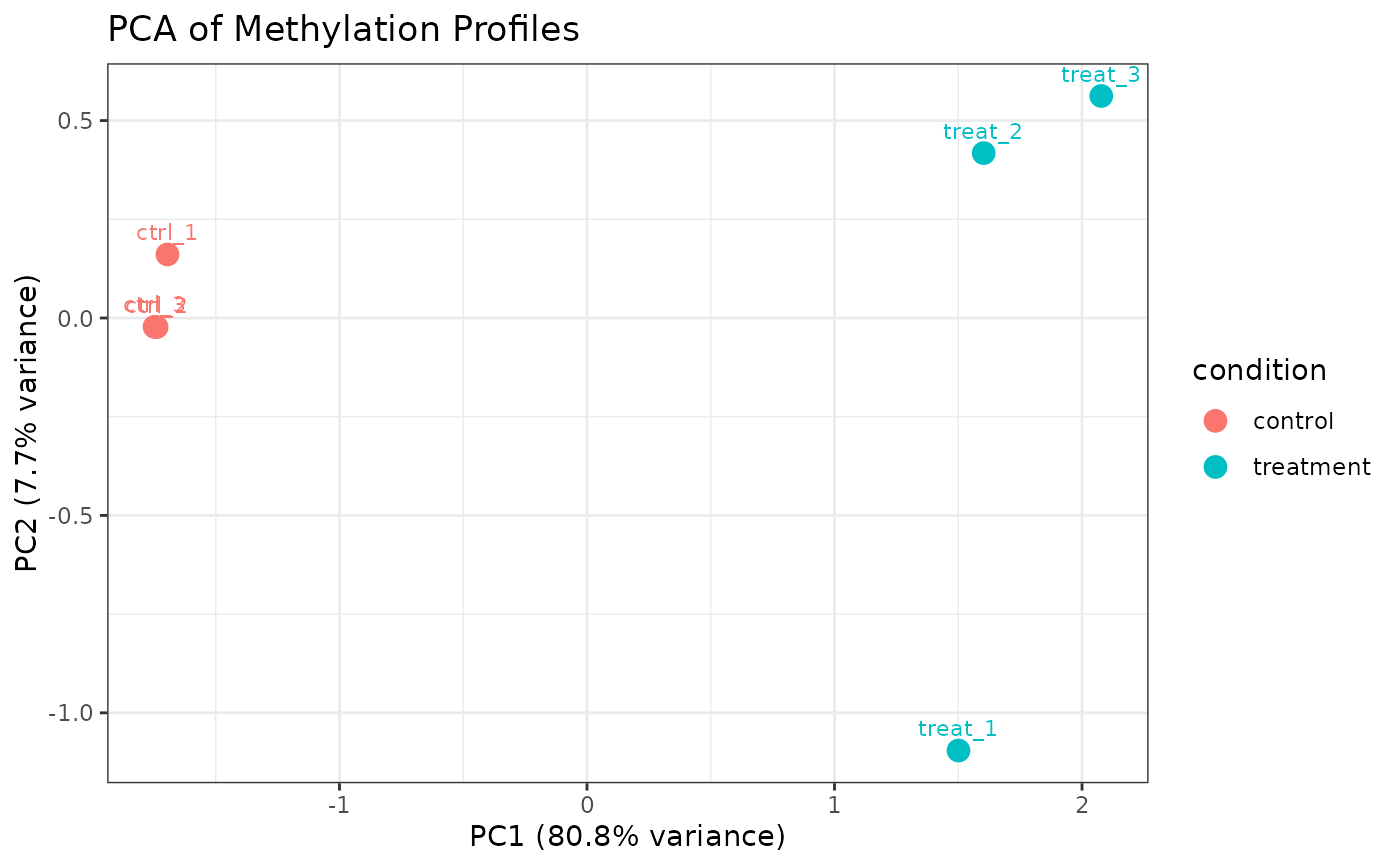
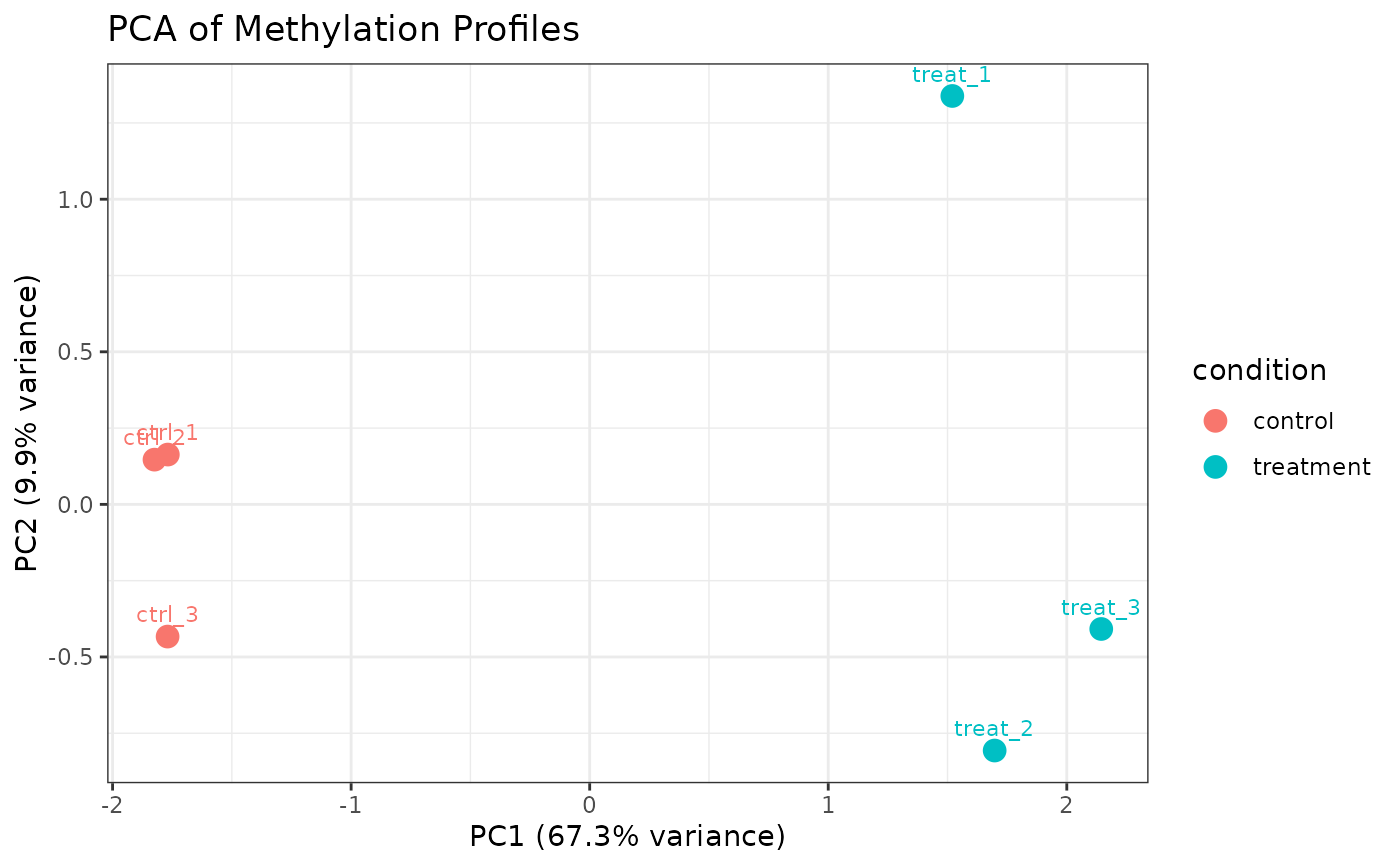
Performs principal component analysis (PCA) on per-sample methylation profiles and plots PC1 vs PC2. Useful for sample-level QC, detecting outliers, and assessing whether biological conditions separate in methylation space.
Arguments
- object
A
commaDataobject.- mod_type
Character string specifying a single modification type (e.g.,
"6mA","5mC"). IfNULL(default), all sites from all modification types are used.- color_by
Character string naming a column in
sampleInfo(object)to use for point color. Default"condition".- shape_by
Character string naming a column in
sampleInfo(object)to use for point shape. IfNULL(default), all points use the same shape.
Value
A ggplot object. PC1 and PC2 are shown on
the x- and y-axes, respectively, with percentage of variance explained
shown in the axis labels. Each point represents one sample and is labeled
with its sample_name. Points are colored by color_by.
Details
Sites with any NA beta values across samples are removed before PCA
to ensure a complete data matrix. PCA is computed via stats::prcomp
with centering (center = TRUE) and without scaling
(scale. = FALSE). A warning is issued if fewer than three samples
are present.
Examples
data(comma_example_data)
plot_pca(comma_example_data)
 # Color by condition, shape by replicate
plot_pca(comma_example_data, color_by = "condition")
# Color by condition, shape by replicate
plot_pca(comma_example_data, color_by = "condition")
 # Only 6mA sites
plot_pca(comma_example_data, mod_type = "6mA")
# Only 6mA sites
plot_pca(comma_example_data, mod_type = "6mA")